

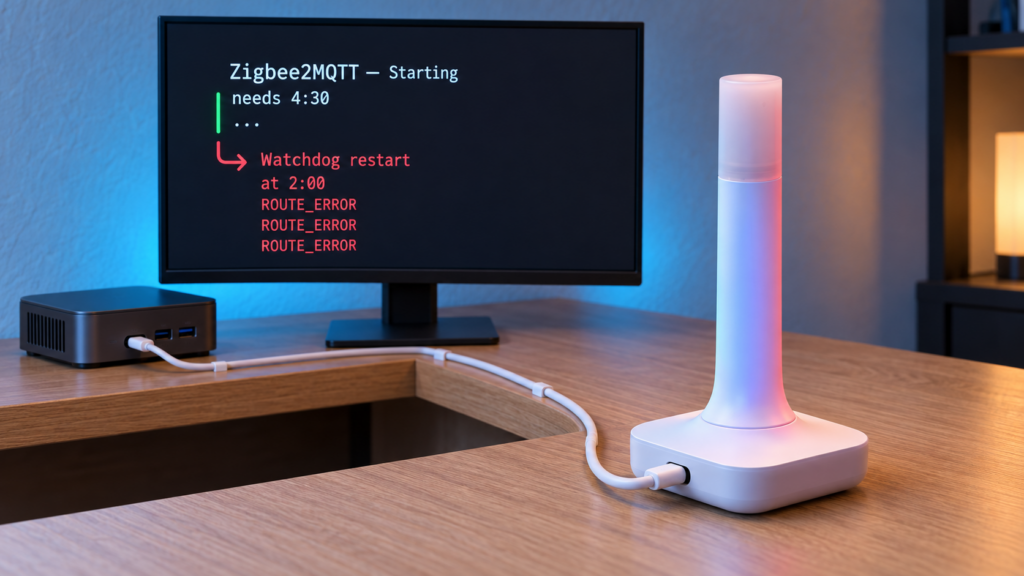
A slow Zigbee2MQTT startup can be interrupted by a restart policy before it finishes. On Home Assistant, first identify whether the restart comes from Supervisor, Zigbee2MQTT’s own recovery watchdog, or another monitor. Turning off the wrong one leaves the loop in place.
The main case below is a user’s report on a Connect ZBT-2, not a universal startup-time limit. Its maintainer replies point to excessive device traffic rather than route discovery as the cause. This guide keeps the reported workaround separate from the diagnosis you need on your own installation.
What Slow Startup Looks Like on a Larger Network
There is no fixed number of devices or number of seconds that separates a healthy startup from a faulty one. Measure your own normal startup and note the last completed phase: radio initialization, network resume, device setup or MQTT connection. A large volume of incoming device messages can delay progress, but a serial error, resource problem or broker failure can look slow too.
A restart loop becomes apparent when logs repeatedly begin a new startup before reaching the ready message. Keep the timestamps and the Supervisor/container exit or restart reason. Repeating a route-error line does not, by itself, establish that routing caused the delay.
Route errors and the reported traffic problem
Issue #33026 reports Zigbee2MQTT 2.14.1-1 on a Connect ZBT-2 with firmware 7.5.1. The user measured about four and a half minutes to resume the network and an approximately two-minute restart window with the Home Assistant app’s Watchdog toggle enabled. Those are measurements and observations from that installation, not a documented global Supervisor timeout.
The log includes Ember stack route errors alongside startup activity. These illustrative lines retain their diagnostic names, but should not be treated as an exact reproduction of every version’s log formatting:
ROUTE_ERROR_MANY_TO_ONE_ROUTE_FAILURE
ROUTE_ERROR_SOURCE_ROUTE_FAILURE
ROUTE_ERROR_INDIRECT_TRANSACTION_EXPIRY
There were maintainer replies on 4–6 September 2026. After reviewing debug logs, the maintainer identified hundreds of incoming messages during startup and named the highest-traffic devices. The reporter continued to suspect routing; the maintainer explicitly rejected that diagnosis and suggested supported reporting changes and newer compatible coordinator firmware. The issue remained open at the October check, without a confirmed universal fix.
The ZBT-2 log uses the ember driver and EZSP protocol. These route-error names are meaningful stack diagnostics, but neither their presence nor an unrelated runtime routing bug proves the cause of this startup delay. The original report relays a Nabu Casa support statement; it is not a direct published ruling that overrides the maintainer’s log assessment.
Two Watchdogs, and Why They Get Confused
The Home Assistant app’s Info-tab Watchdog toggle is controlled by Supervisor. Zigbee2MQTT’s watchdog configuration option controls a separate internal recovery loop, as the maintainer explains in app issue #794. Enabling either does not automatically enable the other.
The internal watchdog documentation describes retries for handled soft failures, enabled with Z2M_WATCHDOG. It does not impose a startup deadline and only takes over after a successful initial start. Configuration failures and deliberate stops are outside its intended recovery path. On the Home Assistant app, watchdog: default supplies the environment variable through its wrapper.
The documentation lists one-, five-, fifteen-, thirty- and sixty-minute retry delays. The released 2.14.2 entry point additionally begins its default array with a two-second retry. For that version, consecutive unsuccessful recovery attempts use:
| Recovery retry | Default delay in 2.14.2 |
|---|---|
| 1st | 2 seconds |
| 2nd | 1 minute |
| 3rd | 5 minutes |
| 4th | 15 minutes |
| 5th | 30 minutes |
| 6th | 60 minutes |
| After the configured retries are exhausted | The process exits |
A successful restart resets the counter. Custom delay lists replace that array; check the log’s printed values for your installed version. A separate older reconnect report #26002 describes adapter/socket retry trouble. It concerns recovery after disconnection, not proof of the same initial-startup problem.
Supervisor’s app monitoring is another layer. Its health probe depends on the app’s declared configuration; the current Zigbee2MQTT app does not declare an HTTP/TCP watchdog URL. The Info toggle is not a user-editable “two-minute startup timeout.” Check Supervisor’s log before concluding it killed an otherwise running process. Container restart policies and external automations can introduce additional loops.
Practical Mitigations
- Capture one complete startup. Back up the data first. Record app/Zigbee2MQTT/radio versions, enable debug logging temporarily and retain the startup timestamps plus the restart reason from Supervisor or your container manager.
- Test the monitor that actually restarts it. If the loop coincides with the Info-tab Watchdog, temporarily disable that toggle and allow one controlled startup to finish. This was the reporter’s workaround, not a guarantee for every delay. Turning it off removes that Supervisor recovery layer; it does not change the internal watchdog or repair an adapter error.
- Check the documented startup failures. The startup troubleshooting page covers serial paths/permissions, resource and power problems, other software using the adapter, cabling/passthrough and network-setting mismatches. Resolve an explicit failure instead of merely lengthening a restart loop.
- Inspect device traffic. Use Zigbee2MQTT’s health information and debug logs to identify unusually high message rates. Where supported, adjust the device’s actual Zigbee reporting intervals and change thresholds to fit the measurement you need. MQTT
debounceorthrottlereduces host publications, not the radio messages already arriving at the coordinator. The spammy-device guidance discusses this distinction. - Review stale devices and mesh health. Remove only confirmed obsolete entries using the ghost-device procedure. Use the network map alongside logs and actual device behavior. Pruning is not an established cure for every startup delay, and weakening working router coverage can make things worse.
- Check the adapter’s exact firmware and mode. Confirm the configured driver from the startup log. Read the compatible firmware’s release notes and backup/migration instructions before updating. A suggestion to try a newer build in one issue is not a guarantee it fixes your network. Do not switch an existing radio into an unrelated multiprotocol mode to test this.
- Restore useful monitoring. After diagnosis, test the appropriate watchdog or use an external monitor with a startup grace period based on your measurements. Check both process state and readiness, for example fresh
zigbee2mqtt/bridge/stateand supported bridge health checks. A retained “online” message by itself may be old, and a container marked running does not prove commands work.
The reporter used a custom HA automation after disabling Supervisor’s toggle. That remains an option, but the monitor needs bounded retries and a grace period; otherwise it can recreate the same loop. Observe recovery after a genuine failure before relying on it.
Frequently Asked Questions
Why does startup take several minutes? Check the stalled phase and incoming traffic. The maintainer in #33026 identified excessive messages in that user’s logs. Device count or route errors alone cannot diagnose every slow start.
Do repeated route errors prove routing is causing the delay? No. They are stack diagnostics. In the cited case, the maintainer explicitly identified message traffic instead, while the reporter disagreed.
How do I stop a watchdog loop? Identify which layer is restarting the process. Temporarily disable that layer for one monitored test, capture the startup and fix the reported failure. The Supervisor Info toggle and Zigbee2MQTT’s internal watchdog option are separate.
Is there a configurable Supervisor two-minute deadline? The cited time is a user’s observation. The current app does not expose a startup-timeout setting through the Watchdog toggle. Inspect the actual Supervisor/container restart reason.
What’s Verified Here, and What to Check Yourself
The internal recovery rules were checked against documentation and 2.14.2 source, and the app wrapper separates its watchdog option from Supervisor monitoring. The timing and device-traffic discussion come from issue #33026 and its replies. No slow startup, firmware change or watchdog automation was tested on our hardware. This is a diagnostic workflow, with the issue’s unresolved outcome preserved.